
JS Debugging - What went wrong?
Types of Errors #
An error could be defined as something wrong with your code. Errors generally can be placed into two buckets:
-
Syntax Errors: Often spelling or other mis-typing errors where we try to use a defined variable or function that does not exist. These show up as error messages in the console, and are usually easier to fix.
-
Logic Errors: Logic errors happen when your code works...just not like you need it to. It doesn't give the correct output or result. There is often not a defined error message that shows which means that finding and fixing these is often harder.
Running and debugging Javascript in the Browser. #
Javascript was originally created to be run in a browser and much of it still is. Because of this we will focus on debugging techniques for the browser.
- Open a sandbox folder up in your editor. In the sandbox folder create an html file called
debugging.htmlwith the html for a basic page. (Hint: In VS Code type ! in your blank .html file...then press the tab key. You are welcome...;) - Create a file called
debugging.js - Add a script element to your
debugging.htmlfile. The script element is how we let the browser know that there is some Javascript code that it needs to fetch and execute.
There are a few special elements in HTML. They are special because the contents of those elements are not treated as HTML, but something different.
<script> and <style> are the most common of these special tags. In the case of <style> the contents are treated as CSS (which we won't talk about much in this course). For <script> the contents are treated as Javascript.
The <script> can be used in two ways: we can add the code we want executed inside of the element, ie:
<script>
  let myVar = 3;
</script>
...or we can put our Javascript code inside of a separate file and link it in:
<script src="debugging.js"></script>This second method is considered best practice and is how you should run our Javascript. The other method is often used for quick proof-of-concept hacking, but the code will usually get moved into a JS file if the code is going to be kept.
- Add the following code to your debugging.js file:
const PI = 3.14;
const radius = 3;
let area = 0;
area = radius * radius * pi;
radius = 4;
area = radius * radius * pi;-
Open your HTML file in a browser. (If you are using VS Code and installed the LiveServer extension you can right click on the name of the file in VS Code and select the 'Open with LiveServer') There is nothing on the screen! This is normal...in our HTML we didn't ask for anything to be on the screen. Open up the developer tools and switch to the Console tab.
-
Notice that there are errors listed. These are syntax errors that will keep our code from running correctly until the are fixed.
-
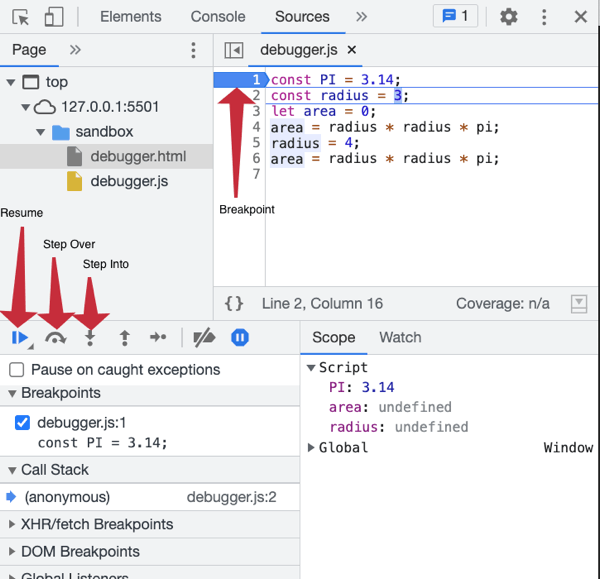
Switch to the Sources tab in the developer tools. Click on the
debugging.jsfile in the left pane. You should be able to see the code you wrote. -
Click on the line number for line 1. It should add a blue arrow on it. We have just set a breakpoint. If you refresh the browser the code execution will now stop on line 1 at our breakpoint.
-
The Resume button should be blue at this point. That means the execution of our code is paused. At this point we could click the Resume button to resume the execution of the program, or Step over, or step into. Step into is for functions, which we don't have yet. so click the Step Over button to advance to the next line in the code.
-
Hover your mouse cursor over the word
PIin the Sources tab. You should see a little popup with '3.14' show up. This indicates what the current value in that variable is. Do not underestimate how valuable this inspect ability is! -
If you click Step Over a few more times we will get to the line with the first syntax error and our execution will end. (Resume button will no longer be a blue 'Play' button.)
-
Clicking on the line number for line 1 again will remove the breakpoint.